Standardized Generalized Hyperbolic Distribution
dist-sgh.RdDensity, distribution function, quantile function and random generation for the standardized generalized hyperbolic distribution.
Usage
dsgh(x, zeta = 1, rho = 0, lambda = 1, log = FALSE)
psgh(q, zeta = 1, rho = 0, lambda = 1)
qsgh(p, zeta = 1, rho = 0, lambda = 1)
rsgh(n, zeta = 1, rho = 0, lambda = 1)Details
dsgh gives the density,
psgh gives the distribution function,
qsgh gives the quantile function, and
rsgh generates random deviates.
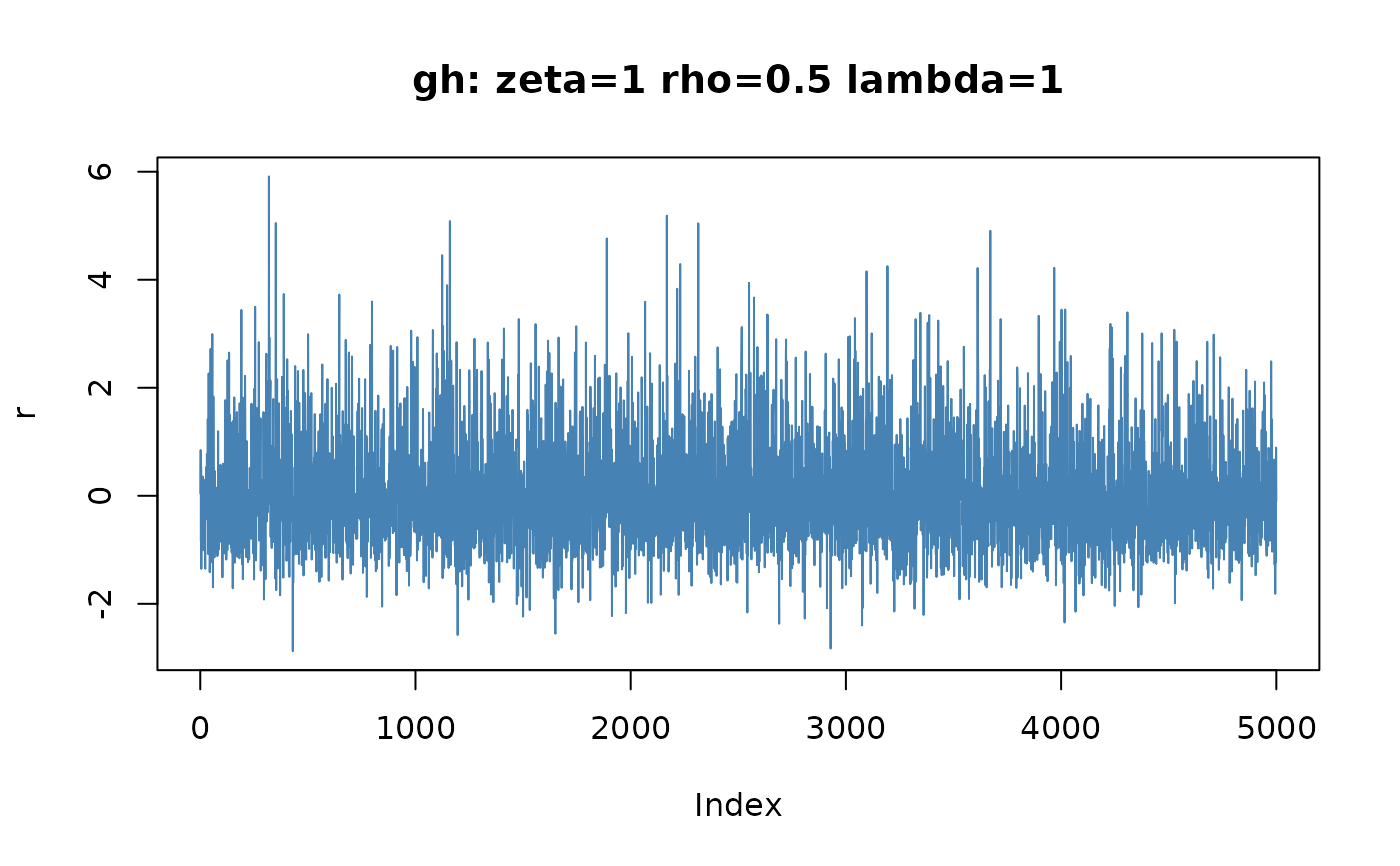
The generator rsgh is based on the GH algorithm given by Scott (2004).
Examples
## rsgh -
set.seed(1953)
r = rsgh(5000, zeta = 1, rho = 0.5, lambda = 1)
plot(r, type = "l", col = "steelblue",
main = "gh: zeta=1 rho=0.5 lambda=1")
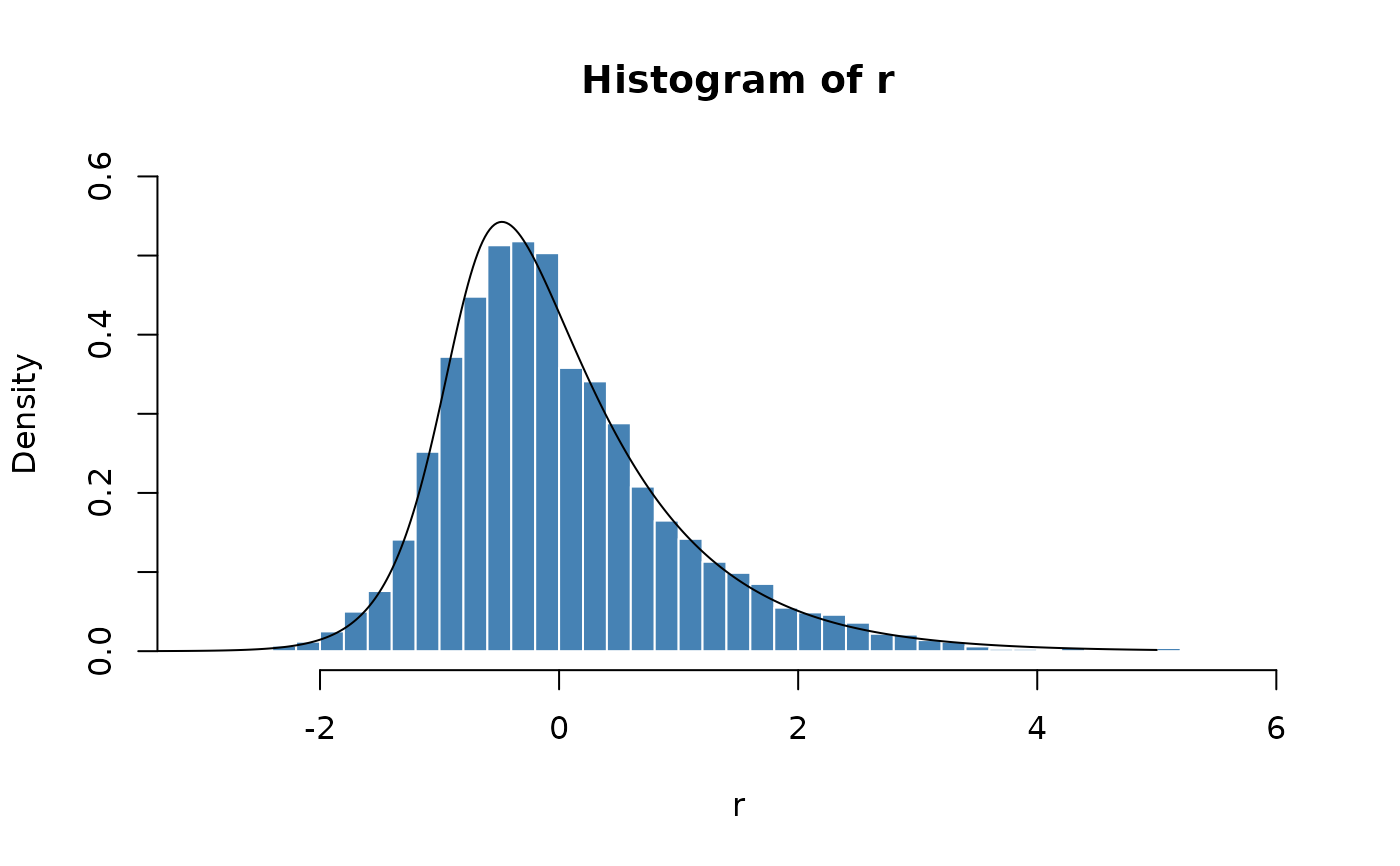
 ## dsgh -
# Plot empirical density and compare with true density:
hist(r, n = 50, probability = TRUE, border = "white", col = "steelblue",
ylim = c(0, 0.6))
x = seq(-5, 5, length = 501)
lines(x, dsgh(x, zeta = 1, rho = 0.5, lambda = 1))
## dsgh -
# Plot empirical density and compare with true density:
hist(r, n = 50, probability = TRUE, border = "white", col = "steelblue",
ylim = c(0, 0.6))
x = seq(-5, 5, length = 501)
lines(x, dsgh(x, zeta = 1, rho = 0.5, lambda = 1))
 ## psgh -
# Plot df and compare with true df:
plot(sort(r), (1:5000/5000), main = "Probability", col = "steelblue")
lines(x, psgh(x, zeta = 1, rho = 0.5, lambda = 1))
## psgh -
# Plot df and compare with true df:
plot(sort(r), (1:5000/5000), main = "Probability", col = "steelblue")
lines(x, psgh(x, zeta = 1, rho = 0.5, lambda = 1))
 ## qsgh -
# Compute Quantiles:
round(qsgh(psgh(seq(-5, 5, 1), zeta = 1, rho = 0.5), zeta = 1, rho = 0.5), 4)
#> [1] -5 -4 -3 -2 -1 0 1 2 3 4 5
## qsgh -
# Compute Quantiles:
round(qsgh(psgh(seq(-5, 5, 1), zeta = 1, rho = 0.5), zeta = 1, rho = 0.5), 4)
#> [1] -5 -4 -3 -2 -1 0 1 2 3 4 5