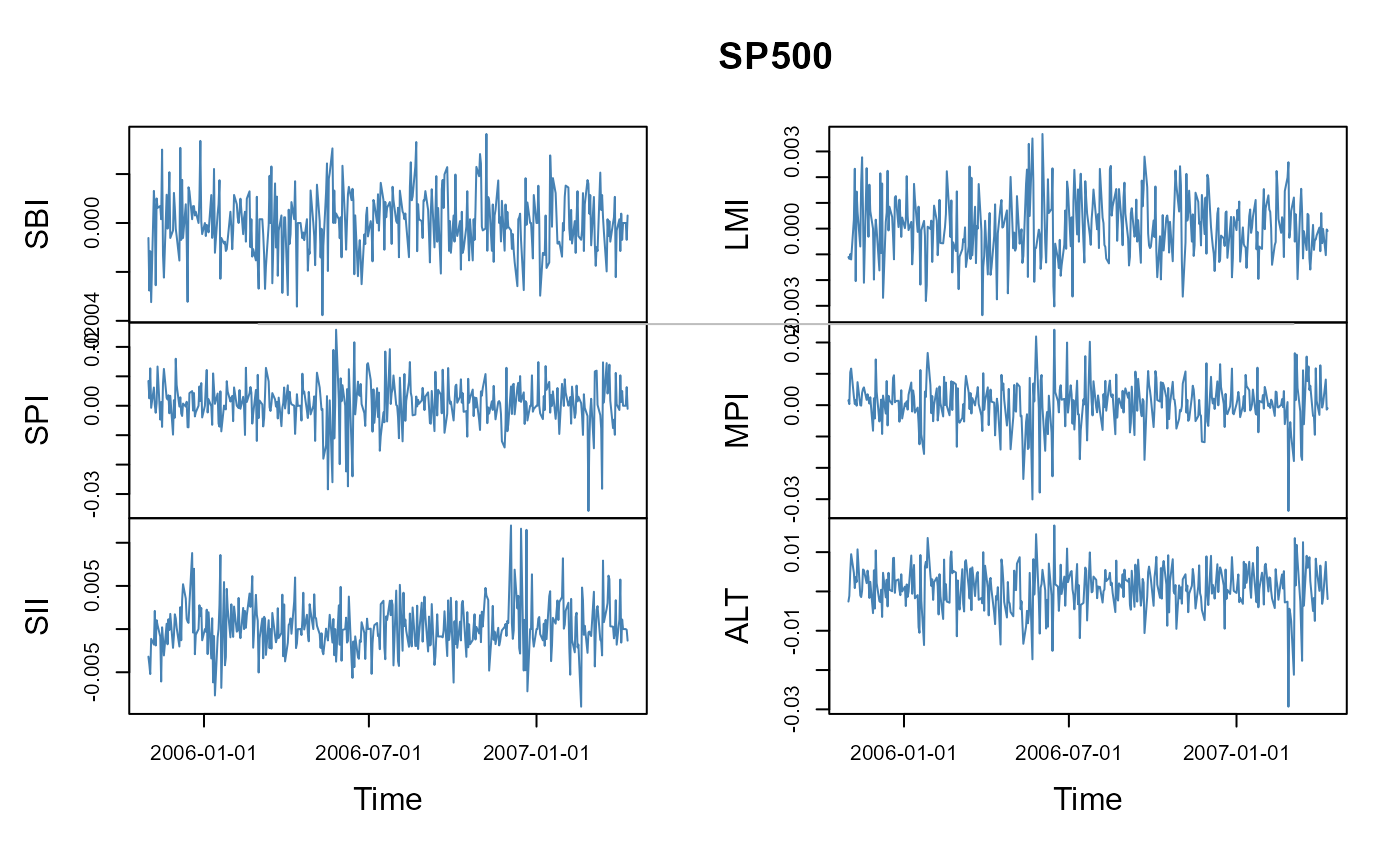
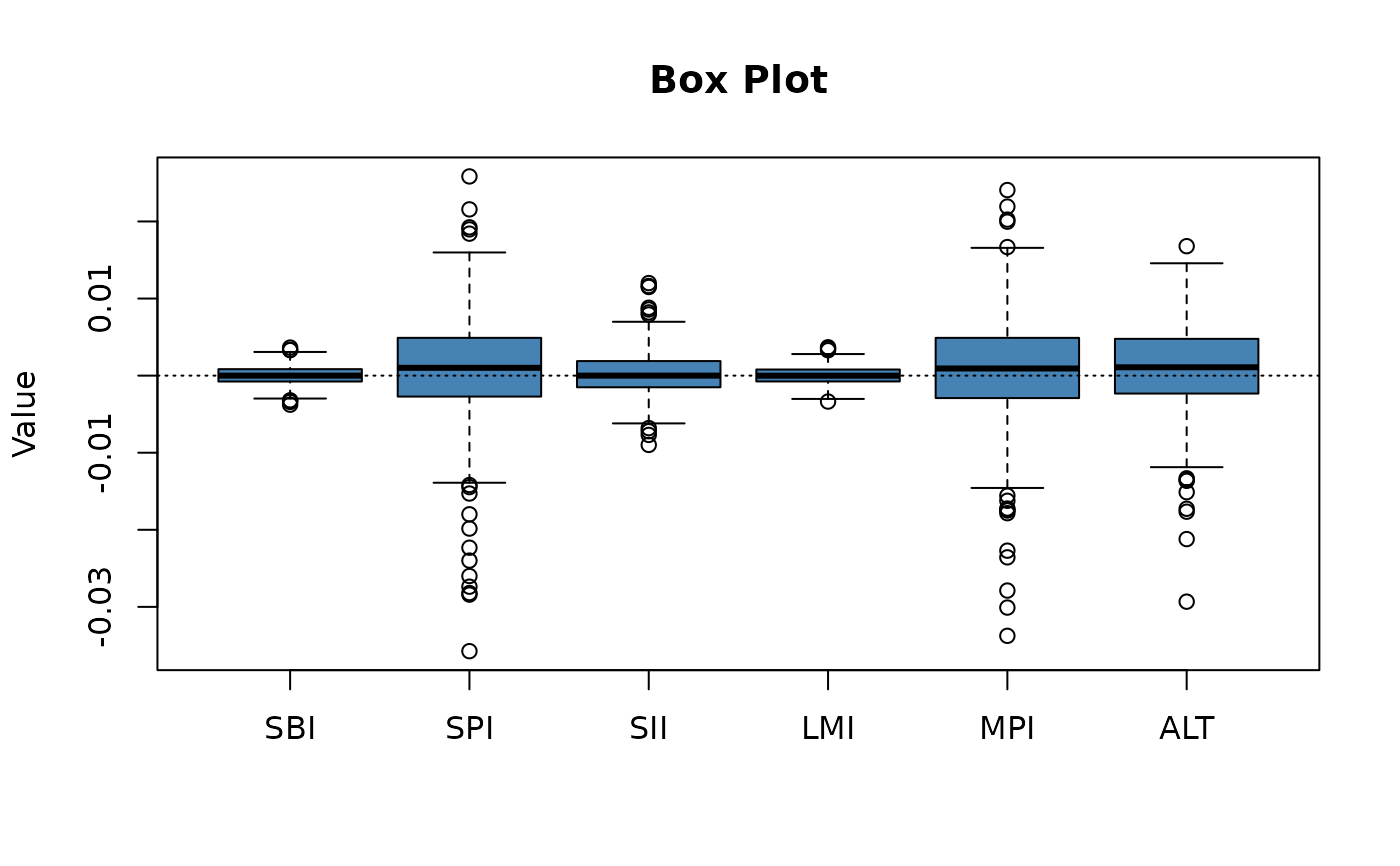
Time series box plots
plot-boxPlot.RdProduce a box plot or a box percentile plot.
Usage
boxPlot(x, col = "steelblue", title = TRUE, ...)
boxPercentilePlot(x, col = "steelblue", title = TRUE, ...)
Arguments
- x
-
an object of class
"timeSeries"or any other object which can be transformed by the functionas.timeSeriesinto an object of class"timeSeries". - col
-
the color for the series. In the univariate case use just a color name like the default,
col = "steelblue", in the multivariate case we recommend to select the colors from a color palette, e.g.col = heat.colors(ncol(x)). - title
-
a logical flag, by default
TRUE. Should a default title added to the plot? - ...
optional arguments to be passed to
boxplot.
Details
boxPlot produces a side-by-side standard box plot,
boxPercentilePlot produces a side-by-side box-percentile plot.