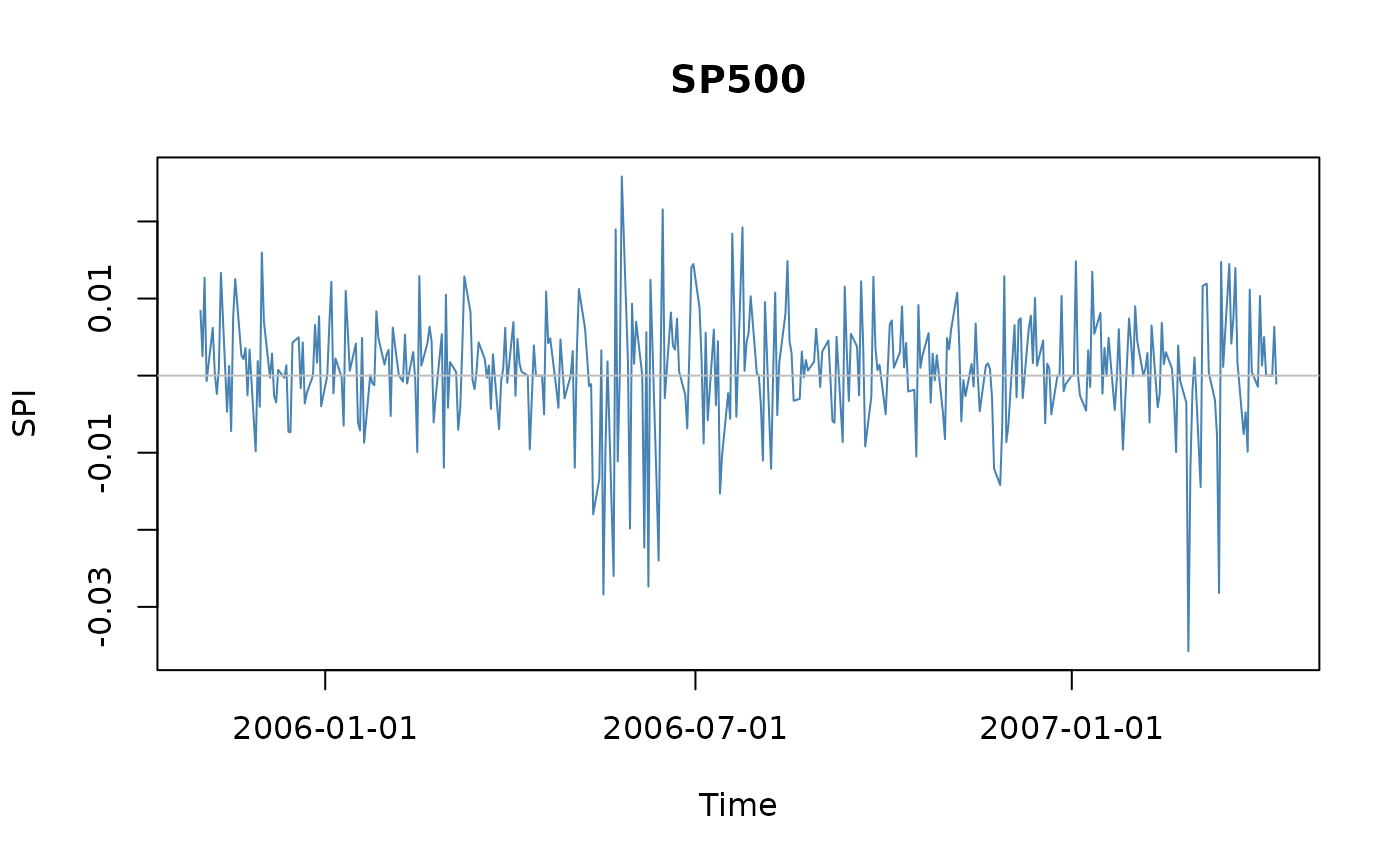
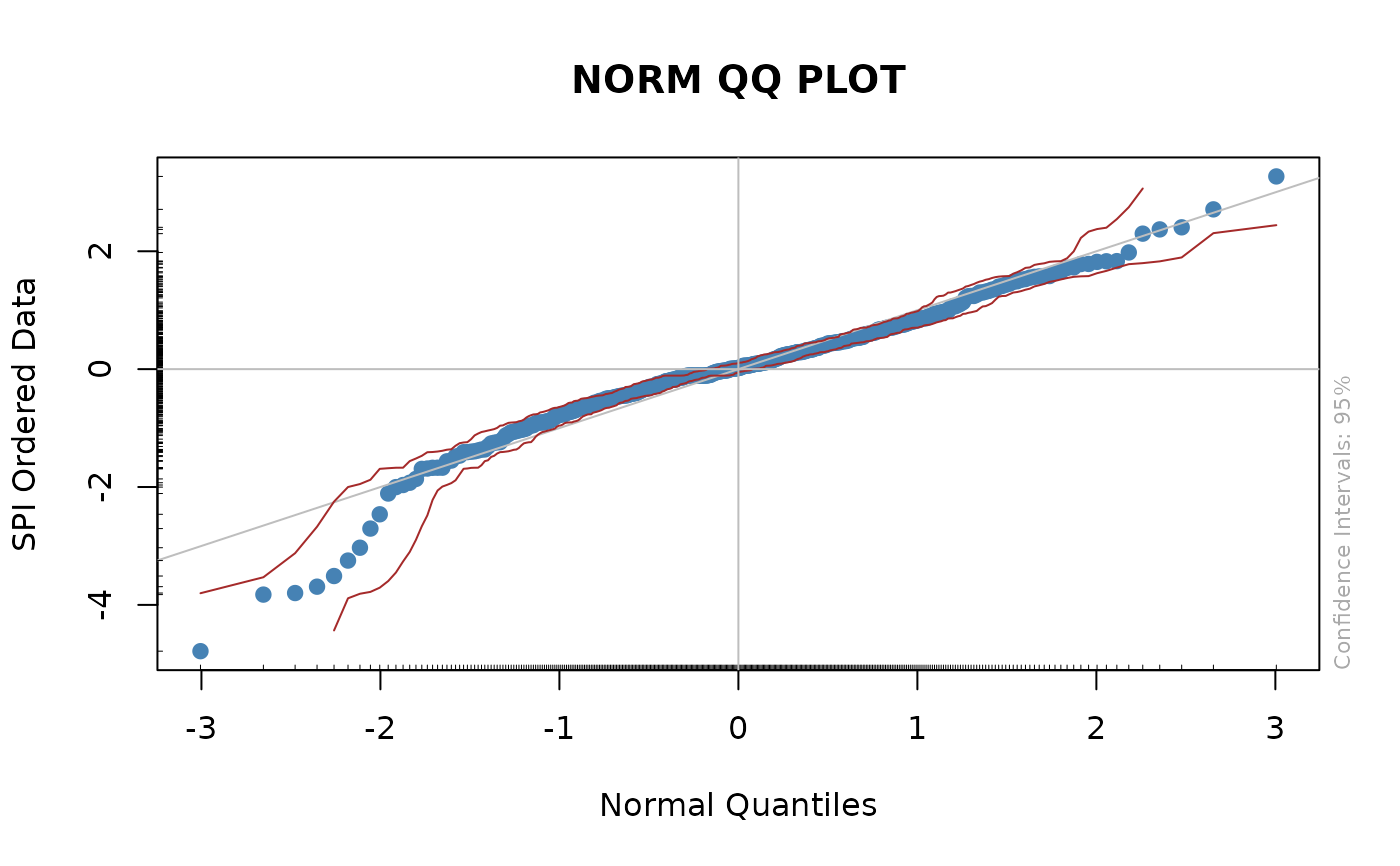
Quantile-quantile plots
plot-qqPlot.RdProduce quantile-quantile plots for the normal, inverse Gaussian, generalized hyperbolic Student-t and the generalized lambda distributions.
Usage
qqnormPlot(x, labels = TRUE, col = "steelblue", pch = 19,
    title = TRUE, mtext = TRUE, grid = FALSE, rug = TRUE,
    scale = TRUE, ...)
qqnigPlot(x, labels = TRUE, col = "steelblue", pch = 19,
    title = TRUE, mtext = TRUE, grid = FALSE, rug = TRUE,
    scale = TRUE, ...)
qqghtPlot(x, labels = TRUE, col = "steelblue", pch = 19,
    title = TRUE, mtext = TRUE, grid = FALSE, rug = TRUE,
    scale = TRUE, ...)
qqgldPlot(x, labels = TRUE, col = "steelblue", pch = 19,
    title = TRUE, mtext = TRUE, grid = FALSE, rug = TRUE,
    scale = TRUE, ...)
Arguments
- x
-
an object of class
"timeSeries"or any other object which can be transformed byas.timeSeries. - labels
-
a logical flag, should the plot be returned with default labels and decorated in an automated way? By default
TRUE. - col
-
the color for the series. In the univariate case use just a color name like the default,
col = "steelblue", in the multivariate case we recommend to select the colors from a color palette, e.g.col = heat.colors(ncol(x)). - pch
-
an integer value, by default 19. Which plot character should be used in the plot?
- title
-
a logical flag, by default
TRUE. Should a default title be added to the plot? - mtext
-
a logical flag, by default
TRUE. Should a marginal text be printed on the third site of the graph? - grid
-
a logical flag, should a grid be added to the plot? By default
TRUE. - rug
-
a logical flag, by default
TRUE. Should a rug representation of the data be added to the plot? - scale
-
a logical flag, by default
TRUE. Should the plot be for the scaled time series? Used byqqnormPlotonly, ignored silently by the others. - ...
optional arguments passed to
plot().
Details
qqnormPlot produces a tailored Normal quantile-quantile plot.
qqnigPlot produces a tailored NIG quantile-quantile plot.
qqghtPlot produces a tailored GHT quantile-quantile plot.
qqgldPlot produces a tailored GLD quantile-quantile plot.
Value
a list containing some of the quantities computed for the plot, invisibly. Currently contains the following components:
- x
the quantiles of the reference distribution, used for the x-axis,
- y
the (possibly scaled) ordered values of the time series, used for the y-axis.
The list has attribute "control" containing the parameters of
the fitted distribution.